World Cube Association
Plot 1
Blog Post
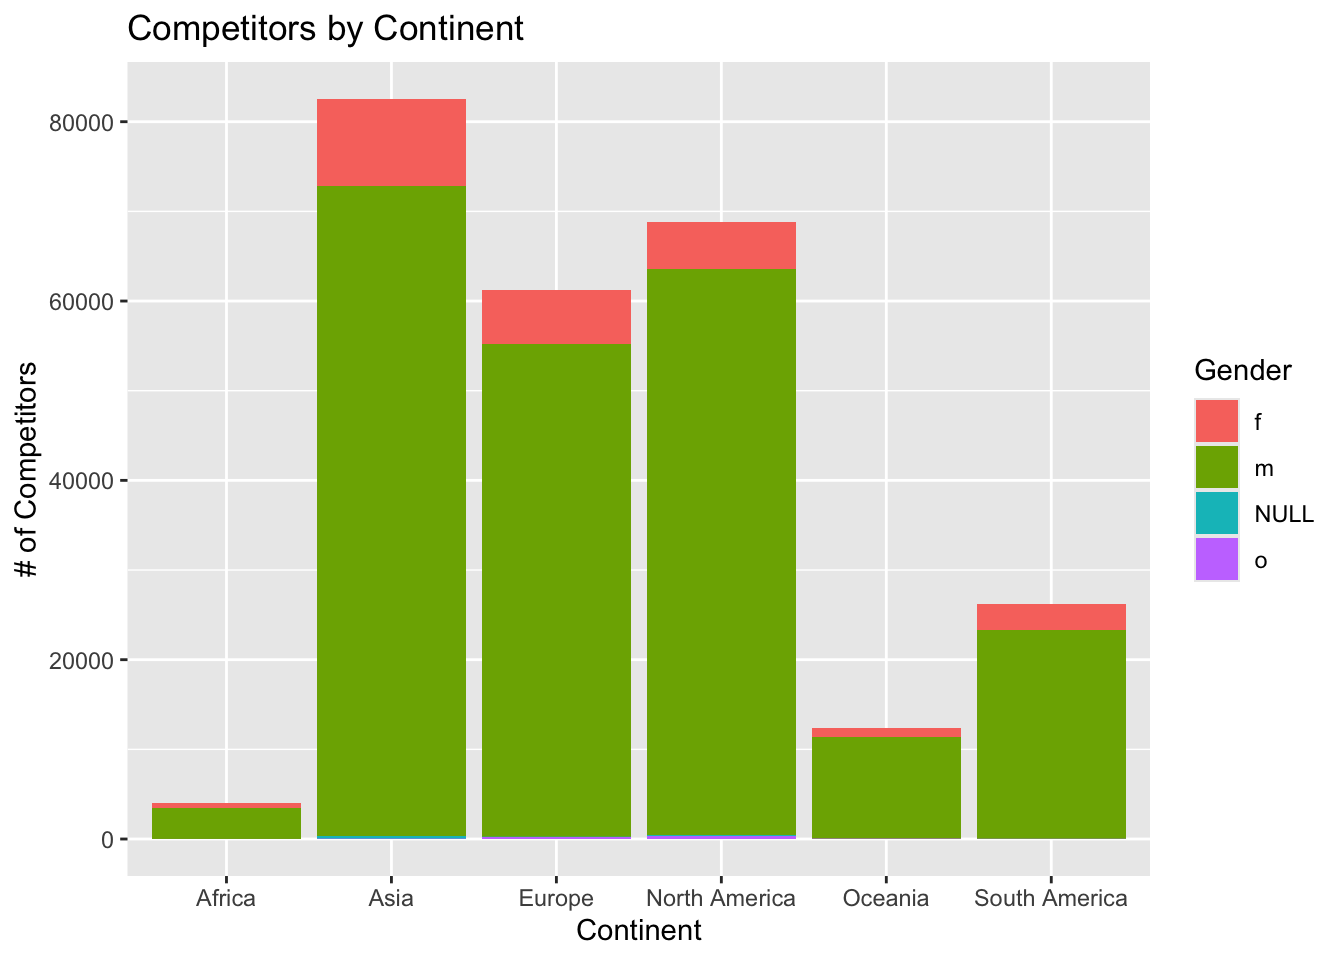
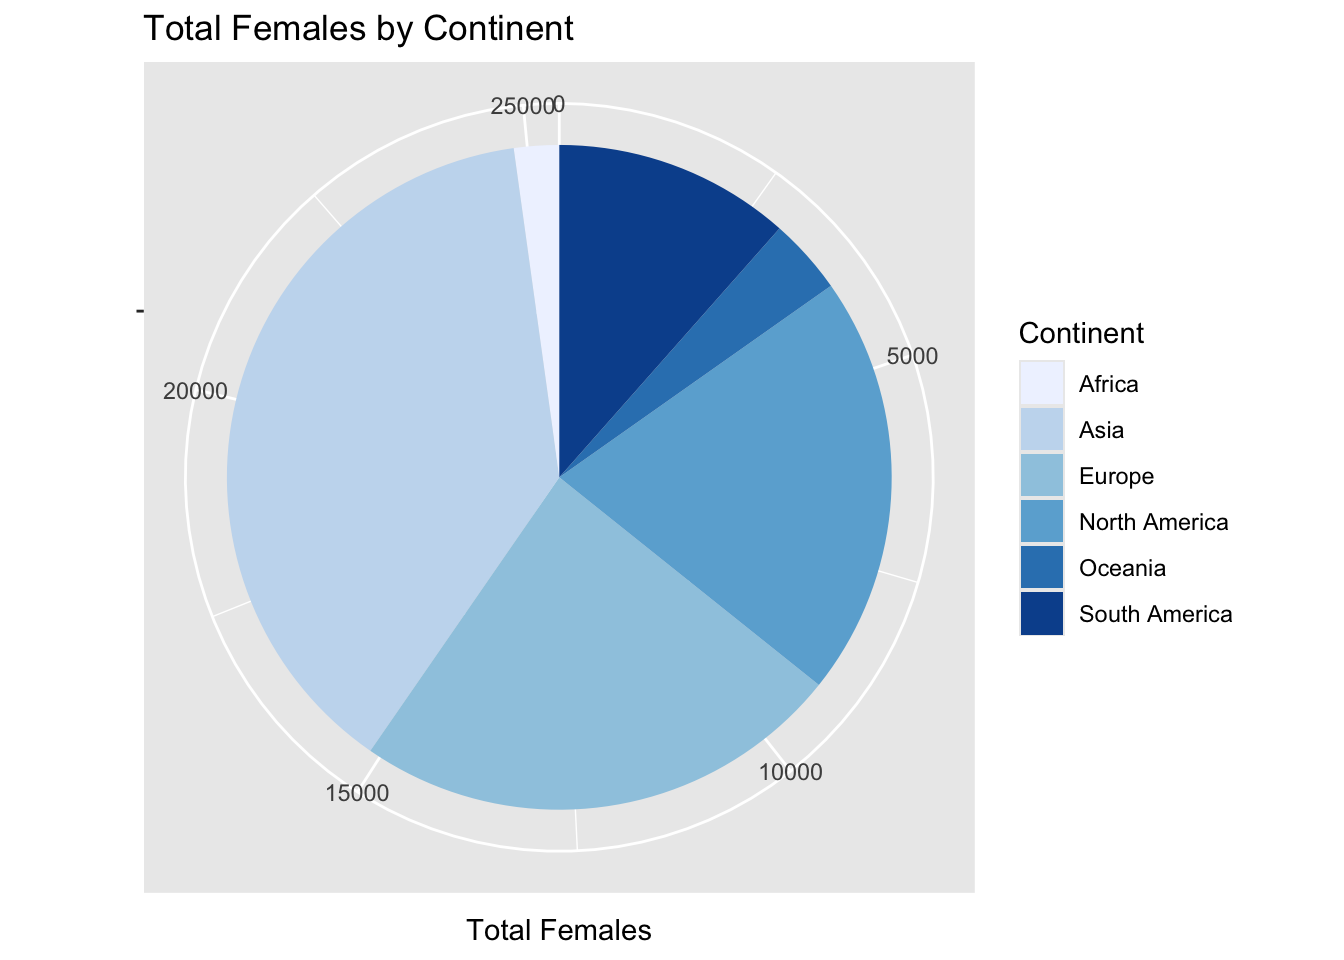
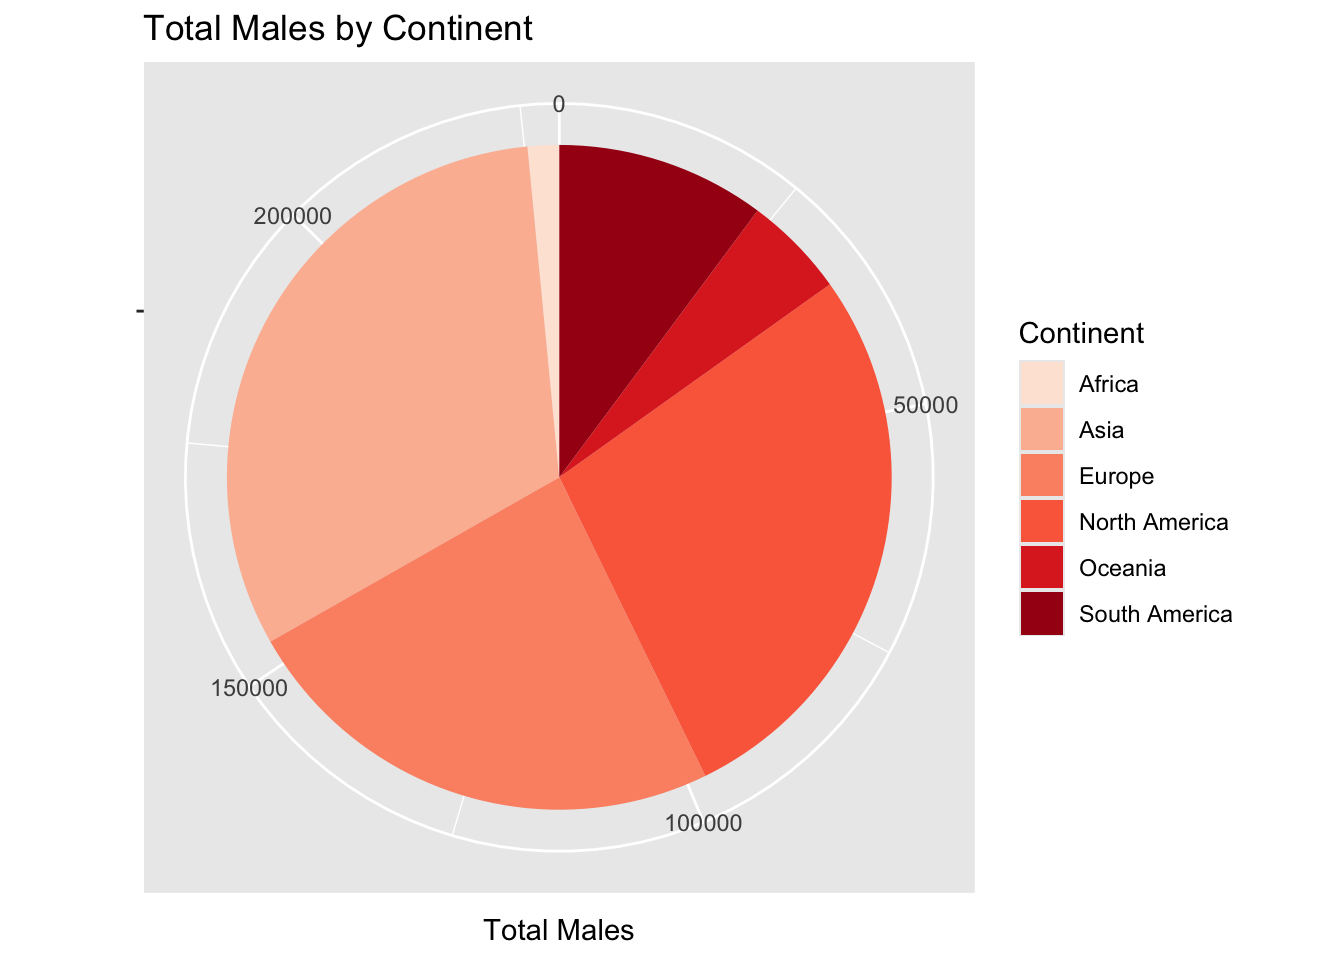
The dataset we are working with contains information about Rubik’s Cube competitions from across the world. These data were recorded and published by the World Cube Association. The data includes information about the location of the competitions, the ranks of the competitors at different levels, the home countries of the competitors, and the gender of the competitors. We were specifically looking at competitions using a standard 3 by 3 Rubik’s Cube. We were interested in exploring the breakdown of gender for competitors from each continent, and the total number of competitors from each continent. Originally, we attempted to look at a breakdown of competitors by country, but these data contain information about competitors from so many countries that it became difficult to look at in a graph form. Thus, we decided to change our question to look at gender by continent instead. This required some data wrangling to match each country to its corresponding continent. The wrangling resulted in a bar graph showing the breakdown of competitors for each continent, colored based on gender. Asia had the most competitors (over 80,000), then North America, then Europe, then South America, then Oceania, and finally Africa (under 5,000). From the bar graph it was immediately apparent that there were more male competitors than female competitors. This was true for each continent. We then decided to display the data in another way, so we made two pie charts. The first pie chart shows the breakdown of which continent the female competitors came from (in blues). The second pie chart shows the breakdown of which continent different male competitors came from (in reds). Key takeaways from our data wrangling and plotting show that across all continents more male competitors attend Rubik’s competitions, and more competitors come from Asia than any other continent, both male and female. When we join datasets we need to consider what new information can be gleaned from combining the data. For example, if we have one dataset with people’s names and how much money they spend on milk, and another set with people’s names and addresses, combining those datasets could lead to targeted ad campaigns, which would not be possible with either one of the datasets by itself. In the case of this dataset, you could use the date and address of the competitions, combined with the names of the competitors attending to find where and when a person was in a location – which could potentially be an invasion of privacy.